He has said that it was the last time he would be doing that (I think I saw it on facebook right after the event).
I know (because I have said exactly the same thing several times) that it might not be true, but what I want to see is people beating this record (people includes me). Unicycling is a living sport, records should be smashed quite often.
5 Likes
I guess you‘re right . Actually, I might have a go at it!
.
.
.
.
.
.
.
Thinking some more about it… …no, I won‘t. I‘m happy if I ever make a tenth of that in 24 hours. But personal records are also there to be beaten every now and then.
1 Like
Thanks! I believe the record could be pushed further, although I’m not attempting it again anytime soon. It’s a huge logistical and costly exercise- finding a track, measuring it, lap timing/counting, volunteers, witnesses, lights, toilets, time off work, weather watching, media interviews. Riding is the easy part.
I knew I didn’t have enough buffer after 12 hrs to go 500km. I was comfortable but not at the same level of fitness as I was in November. While there was less wind, it was warmer and I was slightly dehydrated in the afternoon sun.
I’m waiting on numbers and lap times from my timing manager, but at the 320km mark, I thought I was on track for a 20km/hr average (480km), even accounting for a speed drop below 20km/hr. I used 320km as a benchmark because Sam Wakeling did this in 16hrs20min. I was about 50min ahead of him at this point, reaching this mark in about 15hrs30min.
I expected a speed drop in the second half, but it was more dramatic than predicted - I should have gone to 19km/hr, but I think it went to 17km/hr. I wasn’t sleepy or overly sore, but just couldn’t get my legs to spin.
In terms of seat- my setup was very comfortable. The first dismount was at 6 1/2hrs, and I could have ridden another hour to break Sam’s no-dismount record if I had remembered what his record mark was.
I had a sore butt, but it was from my glutes powering the unicycle, rather than saddle pressure. That’s why I needed a butt massage, and later on a hamstring and calf massage at each stop. There was no crotch chafing at all after 24hrs.
The tyre rub on my distal thigh- only happened a few times when my concentration lapsed. It didn’t hurt much even though it looked bad, and certainly didn’t slow me down. A taller rider will be fine- I have short legs even accounting for my height.
My experience with aerobars is very limited compared to Aurélien’s. I decided to use them after my practice ride in October. Initially I thought the Mad4One Long Handle would be sufficient, but toward the end of my 12hr practice ride, I wanted to reach out further and support my upper body. So I got the URSLI extension from Mad4One, and reconfigured the long handle-saddle. It took a few rides to get used to- I’m no faster on them, but they provide upper body support, staving off fatigue. Because I wasn’t allowed custom equipment (Guinness rules), I didn’t use my V-frame, which would have more options in terms of aero bar attachment. My bars didn’t feel too close to my ribs, but I would have liked a wider set-up. The other important factor is stiffness- and the handle-saddle is very stiff and strong. I wouldn’t trust something that long if it was flexy.
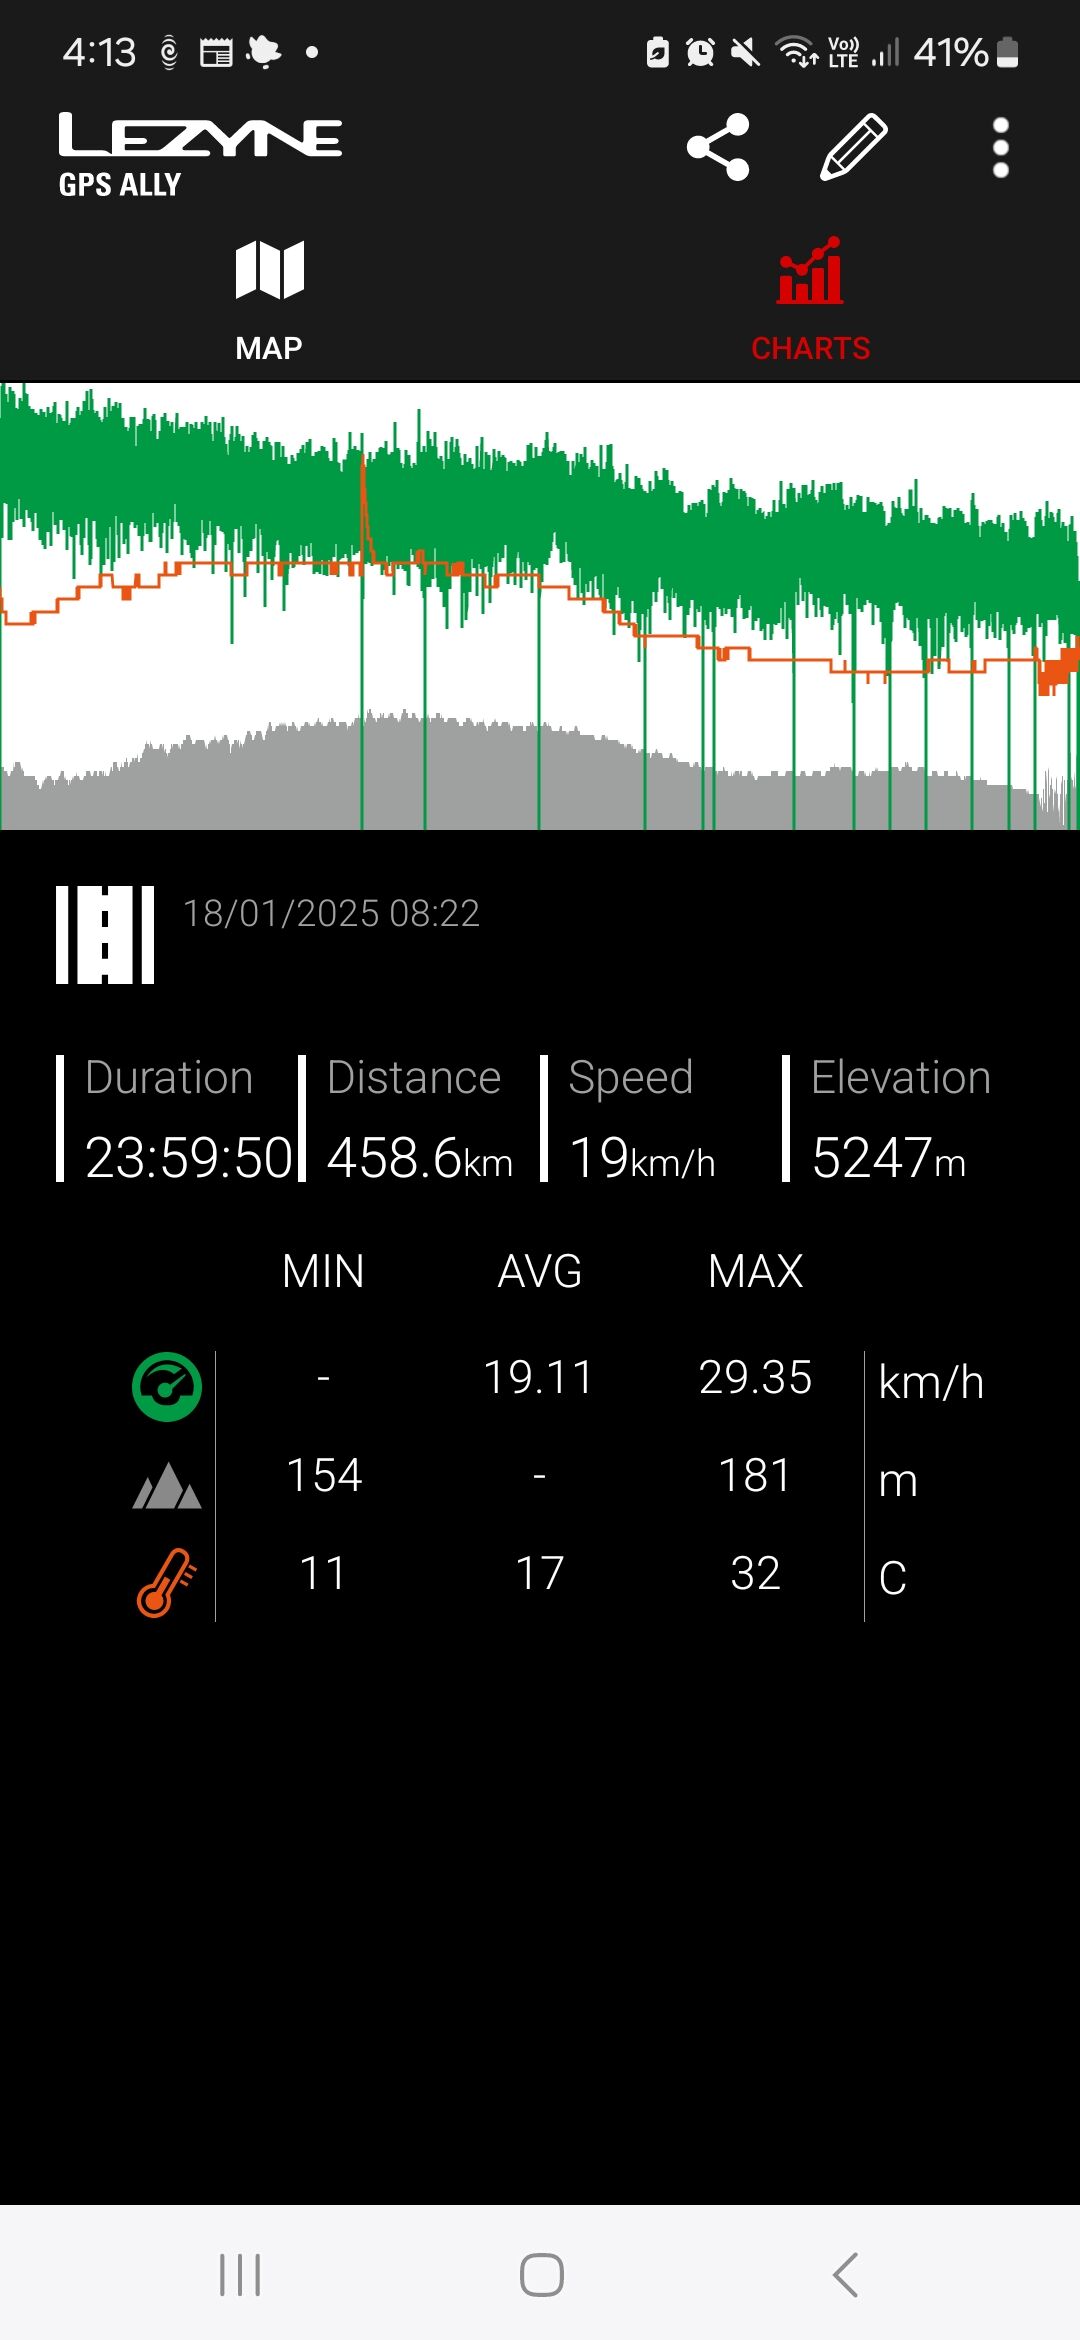
Regarding Everesting- I said it in jest. There is no way I did 15km of climbing. I ran Strava on a mid-range Samsung A54 Android phone, which is not going to be overly accurate. I also tracked the record on my Lezyne MegaXL cyclecomputer, which says there was 5247m of climbing. That would mean 455km/2= 227.5
5.2/227.5= 0.023* or 2.3% gradient. That seems closer to what it felt like.
*sorry I’m not going to do pythagoras theorem on this!
8 Likes
Congratulations! and unlike the bicycling 24-hour records, your track and personal and cycle setup was nice and “low tech”. Yes, bicycles can go twice as far but I reckon your achievement deserves twice the appreciation! (And no real chafing - that is amazing, I am envious).
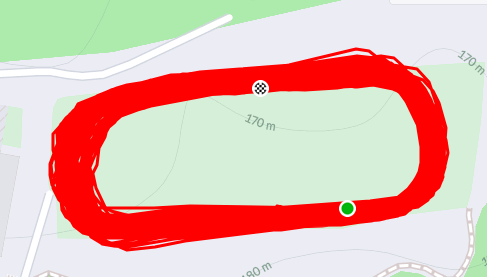
I am a little curious about the GPS data. It is well known that GPS distance (and elevation) accumulation tends to be an over-estimate. The loop near your former school seems like it would have pretty good satellite reception so it should be a “best case” test for GPS distance measurement accuracy as the real distance travelled (excluding a tiny bit of unicycle wobble) is very precisely known for record purposes. So, if you have this data, can you please tell us what your two GPS devices gave as their estimate for the 455.2km total, as this “experiment” gives a precise guide to the limits of GPS device accuracy?
And one more question (useful for anyone measuring distances for unicycle competitions) is what were the Guinness measurement requirements? - was a rolling survey instrument to be taken around the track 20cm from the inside edge or something like that?
2 Likes
I’ll make a blog post once I’ve crunched the data, but briefly, I ran Strava on my Samsung A54 android phone, which measured 471.30km, 15,223m climbing and 23hrs08min moving time.
The Lezyne MegaXL GPS computer read 458.6km, 5247m climbing.
Guinness measurement is taken from the inner circumference of the track, so you will always ride further by a factor of 2 Pi times distance from the inner edge. When you’re tired, it’s hard to hug this too closely.
The track was measured by professional surveyors. They walked around with this machine that took multiple points and stitched them together digitally.
5 Likes
Thanks, that is a nice summary graph produced via the Lezyne “gizmo” (should I “duck” for cover when making a silly joke?). The gradual small speed decline over the day is clearly demonstrated, and each of your 14 (?) stops is obvious by the vertical green line. None of the stops seem very long at all from the graph, although the Samsung gizmo showed a total of 52min without significant movement. (perhaps “non moving” data points are excluded from the GPS ALLY graph?). There seems to be a temperature spike at the first stop - perhaps the gizmo was sitting at a hot spot or near some metal in the sun. I see that the elevation shows a “drift” over the day of about 27m from the fact that it is really measuring barometric pressure (adjusted by cross checking with GPS elevation at the start). Barometric readings are apparently a good way to get accurate small changes in elevation on each loop, although you would have to zoom in on the GPS ALLY graph to about a 10 minute sample to work out the average elevation gain per loop (preferably at night to reduce any sun/shade temperature effects on the barometric sensor contained in the gizmo).
I know that the talk of “Everesting” was just jest, but it is a pity the surveying team didn’t set up a simple level on a tripod and measure the height difference between the highest and lowest part of the track, so you could see the amount of climbing handicap you overcame to set your well deserved distance record.
It is amazing that the total distance computed by GPS ALLY was so accurate (a mere 3.4km more). Perhaps the software detected repeated loops. Perhaps also the fact that the Lezyne is bicycle specific and you were travelling continuously at a fairly constant “bicycling” speed on a track without sharp corners meant its sampling and smoothing algorithm was working nicely in its design space.
Usually the data from a gizmo, when uploaded to GPS ALLY or Strava, is post processed, for example checking the elevation for the latlon by using a Digital Elevation Model derived from satellite measurements. For example, Google Earth uses this - when you view the Newlands track in Google Earth it is possible to see nearby tennis courts, but Google Earth shows an elevation difference of about 3.5m between two ends of a tennis court - clearly not possible in reality! - either the Google model is really out of date (the elevation model before the tennis court construction, but the imagery overlay more recent) or more likely the model interpolates from a coarse grid. Anyway, this sort of thing may have tripped up the Samsung based calculations and means even the more reasonable Lezyne climbing distance should be treated with caution.
Sorry this comment is a bit “off topic”. I can’t help myself as I have an interest in GPS data interpretation as I wrote a GPS tracking app a few years ago (and that brings out my curiosity and skepticism).
3 Likes
I’d bet that they have elevations. Their GPS measurements around the track would have recorded X, Y and Z coordinates for each point.
I agree, Jim - the surveyors would have had precision elevation (Z) measurements available to them with the equipment they were using.
I don’t know whether the survey equipment does elevation, we had assumed it was flat. The track looks both oval and flat until you ride it. Not sure what the brief was, but I spoke to the company that built the track 4yrs ago and it wasnt surveyed after being built. On the contruction plan, the track was supposed to be 404m. I’m guessing the school wanted an approx 400m track for their 11-12 yr olds to run on, but not the expense of a certified athletic track.
The netball courts have been there since I attended school in 1989-1990, so it’s not the google map being out of date.
The Lezyne unit was shaded by my body throughout the ride, hence the temperature spike at the first rest stop- it was sitting on the grass field under the sun. Later rest stops were in the evening or night time. The weather forecast said 20 degrees, but it felt more like 30 with the sun on my back and reflecting off the concrete.
I’m waiting for my timing manager to give me the lap times for each lap, which I’ll post for reference. I think you’ll see each of the night stops were preceeded by a couple of slow laps, then an increase in speed once I’d had a stretch. There seems to be the biggest drop in speed at 12-13hrs as it got dark, which may not be apparent in the fuzzy trend line.
In terms of stops I count 14-15. Usually no more 2-3 min but it all adds up. You can see a few slow laps at 4-5hrs which was me taking on board powerade or chocolate milk.
1 Like
This is the old Garmin Edge 200 computer I used in practice to get an idea of speed. I do 12 lap sets, which is just under 5km. You can see the elevation chart ranges from about 173m to 183m with each lap.

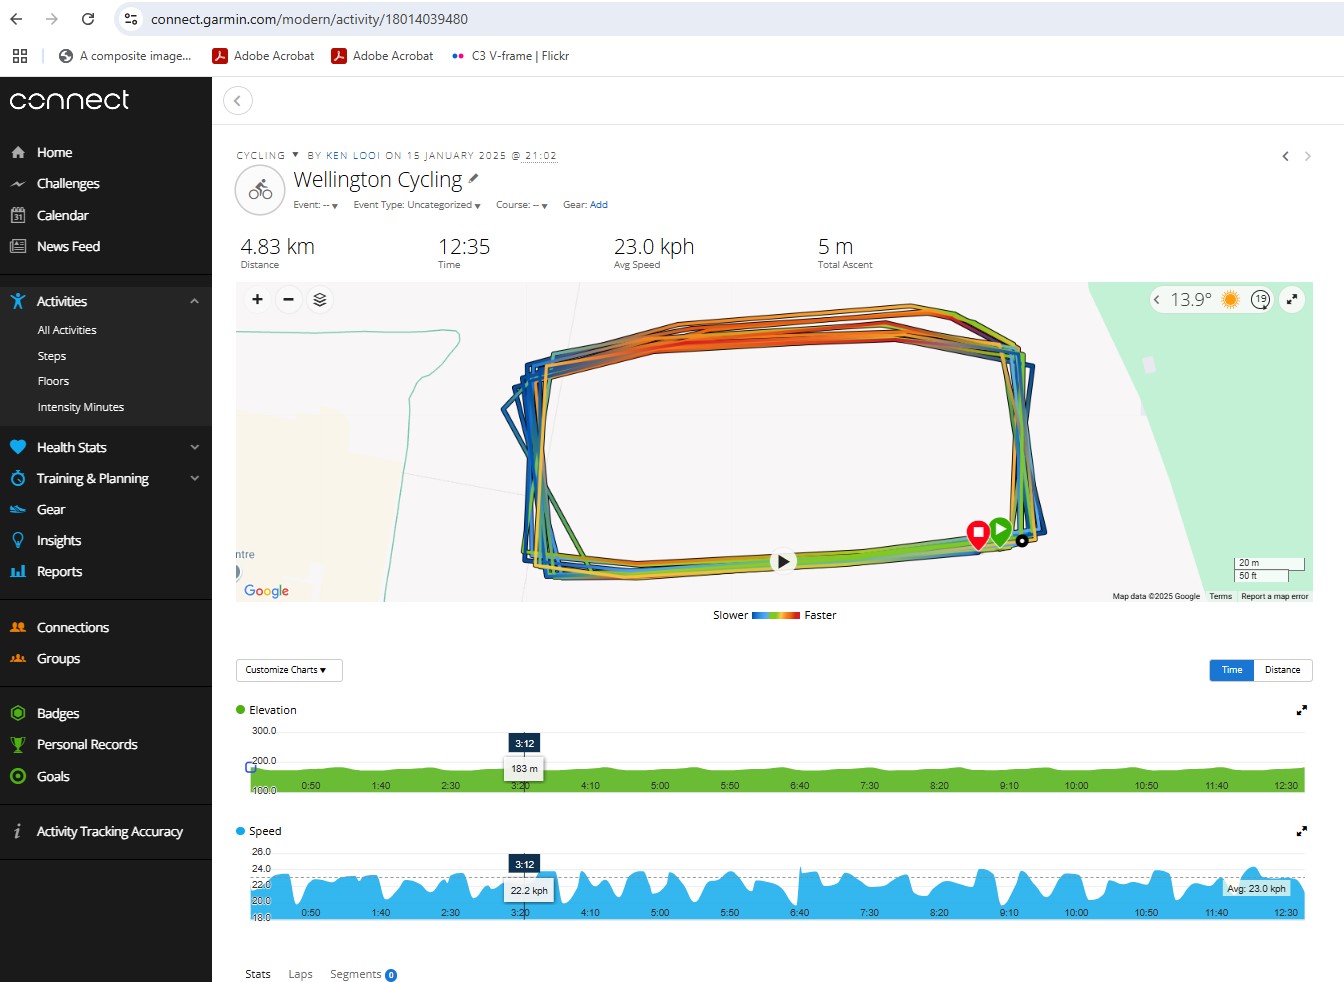
OK we have some more charts, from Garmin.
I like the colored track denoting speeds, which nicely shows a consistent fast (presumably downhill) portion of the track.
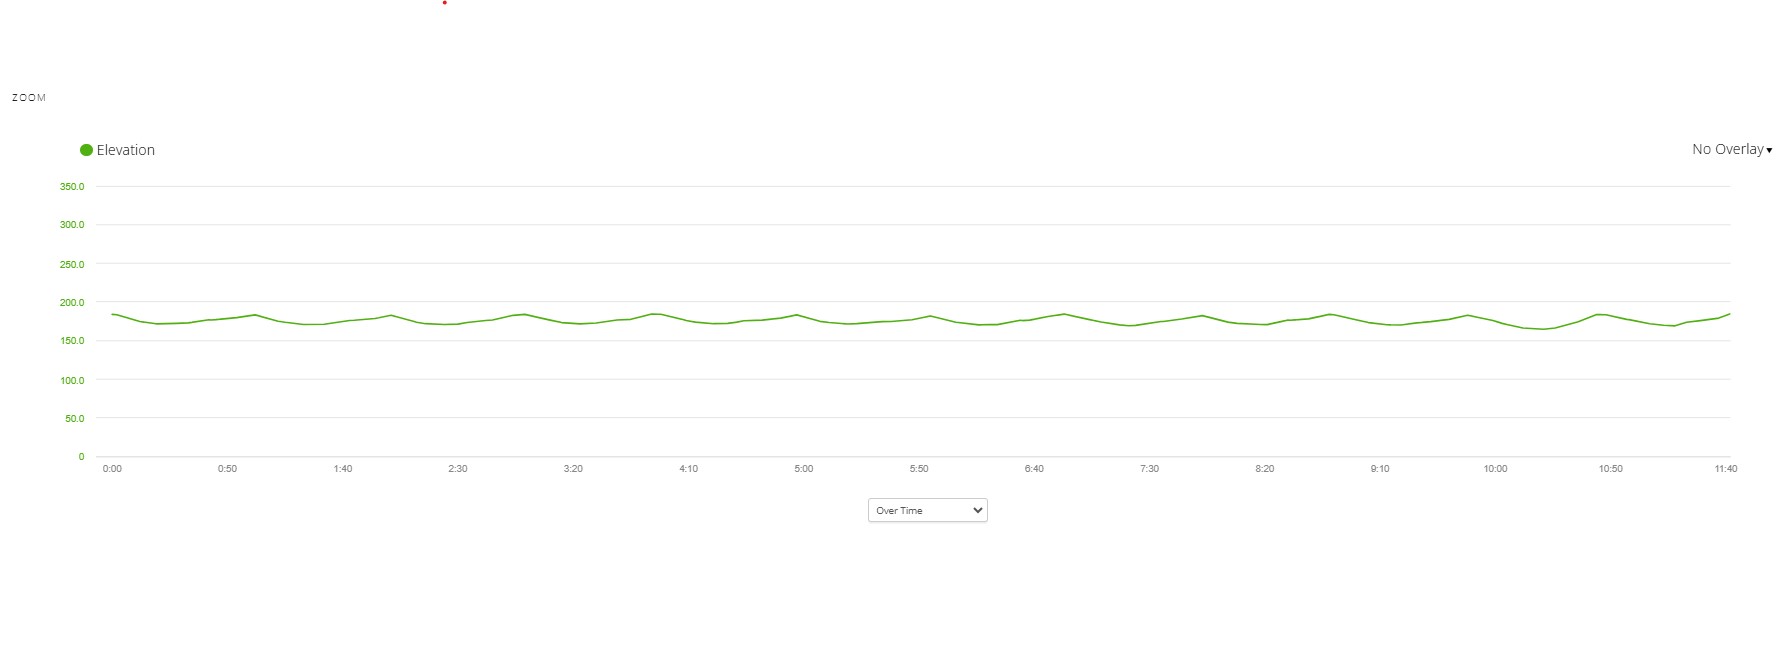
I am a bit confused by the green elevation charts. Yes, they all seem to indicate a change in elevation over the loop of about 10m, BUT the graph page also clearly says “Total Ascent 5m”. Garmin support web page confirms that “total ascent” is the sum of the upward segments of the track which ignores the downward segments. Therefore, the ascent per loop (which should be the same as the elevation min to max over the loop) is 5/12m, or approximately 0.42m, which is VERY different from 10m. hmmmm!
One unlikely hypothesis is that Garmin support is wrong, and total ascent is the sum of all ups and downs, which should mean it would be zero on a closed loop, and 5m would just represent accumulated error, but this defies common sense and standard usage (as well as Garmin support page).
Another possible hypothesis is that the green graphs have been post-processed by an inappropriate digital elevation model (like my sloping tennis court Google Earth example in previous post).
I suppose it is even remotely possible that the Garmin “Total Ascent” is actually per loop, but then why is the distance travelled not distance per loop? (and there would still be a discrepancy of 5m versus 10m!)
Like I said above, “confusing”!
2 Likes
Yes, I couldn’t figure that out either. It certainly doesn’t feel like I’m gaining/losing 10m each lap. Probably 1-2m seems more likely.
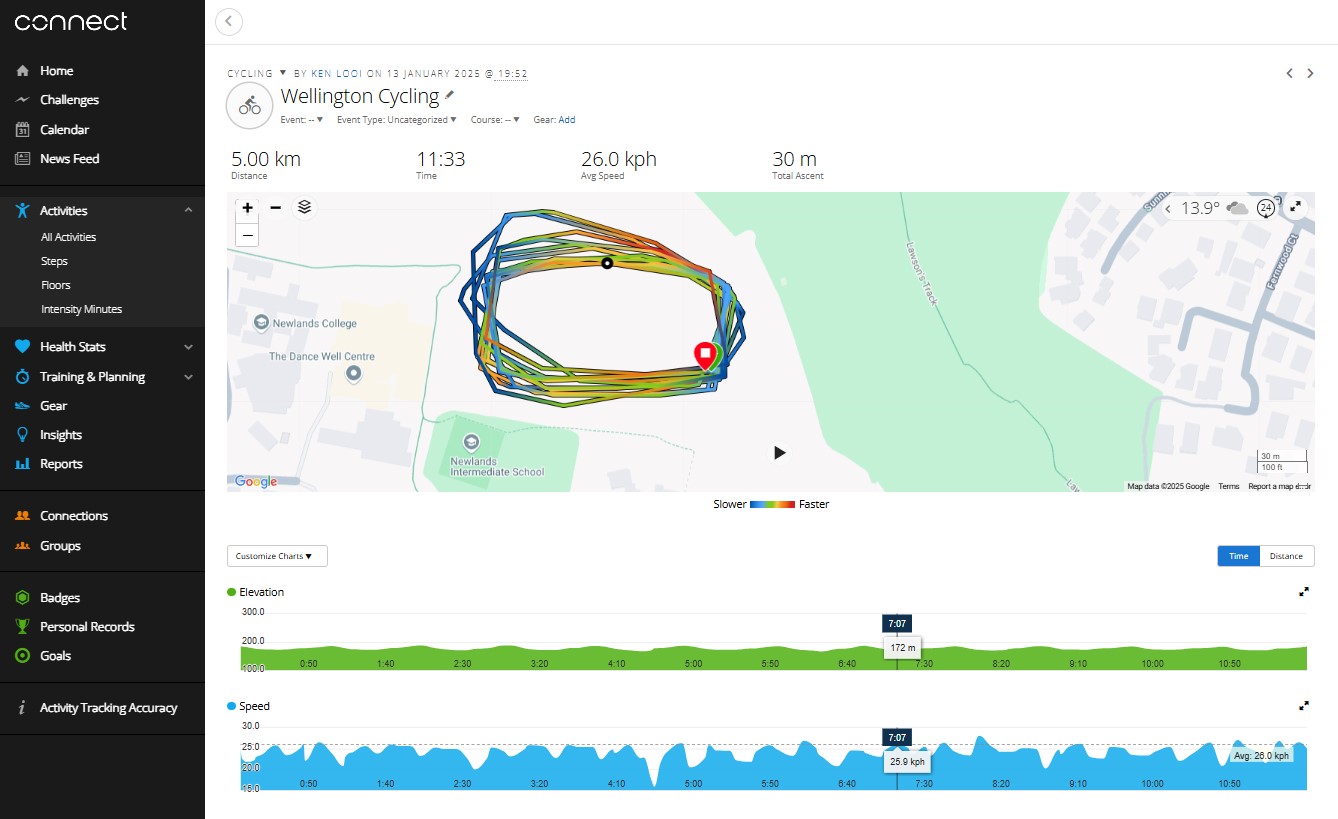
Here is another set of 12 laps, showing a calculated total ascent of 30m on my Garmin. The only conclusion I can make is to take GPS elevation calculations with a grain of salt. The implications may be significant for Everesting attempts though.
Yeah, maybe for “Everesting” it would be best to take some very long rides up some very big mountains - then the GPS errors would not dominate ![]()
![]()
3 Likes
I confirm that’s the case. Have a look at this activity of mine:
“Ascension totale” means “Total ascent”.
This has been done when riding up and down a mountain 3 times in a row. The total ascent is definitely… Well, the total ascent ![]()
There can be some GPS error, as I often get a few meters of difference between total ascent and total descent on a loop. During the aforementioned activity, there has been a 5m error… Which is very little compared to the total.

However, if the track is a small loop, I can’t imagine how many times the error would repeat itself…!
1 Like
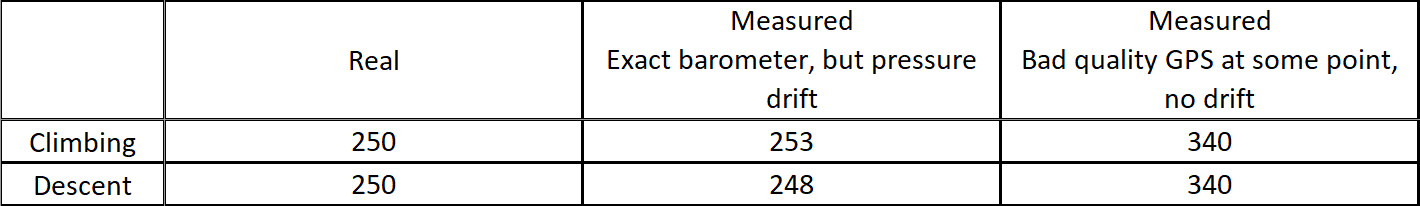
There is not a 5 m error, but a five meter difference between ascent and descent… It doesn’t imply that one of the values is true.
Let’s take an example of that:
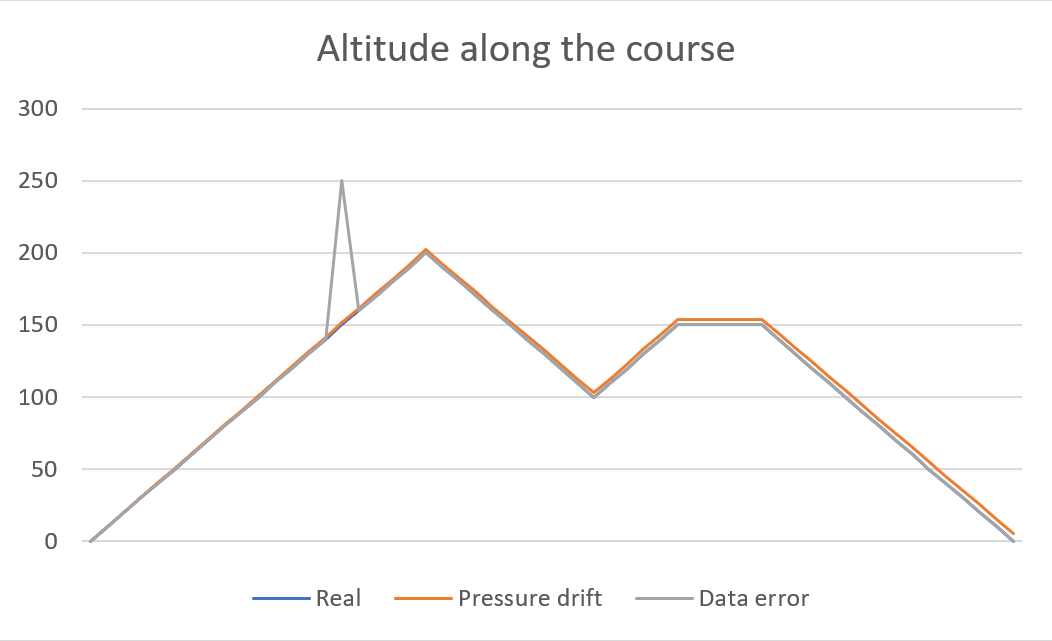
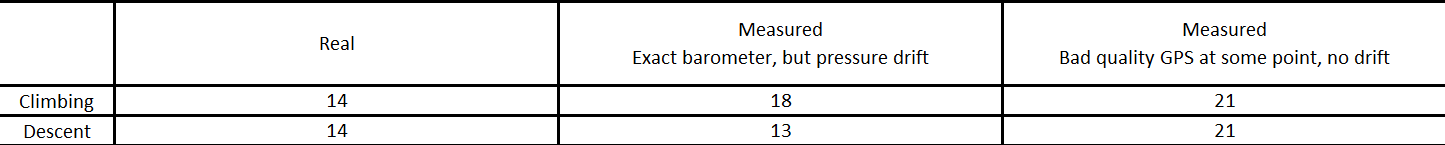
- There is three curves : the real altitude (blue), a barometer based altitude, very close to reality, but with a pressure drift along the day (grey) and a GPS based altitude, very close to reality, but with an error at one point (orange)
You can clearly see the GPS error, but the final data shows a difference of 5 m between climbing and descent in the barometer data, with basically no error, and no difference between the climbing and descent of the GPS, but with difference between both values.
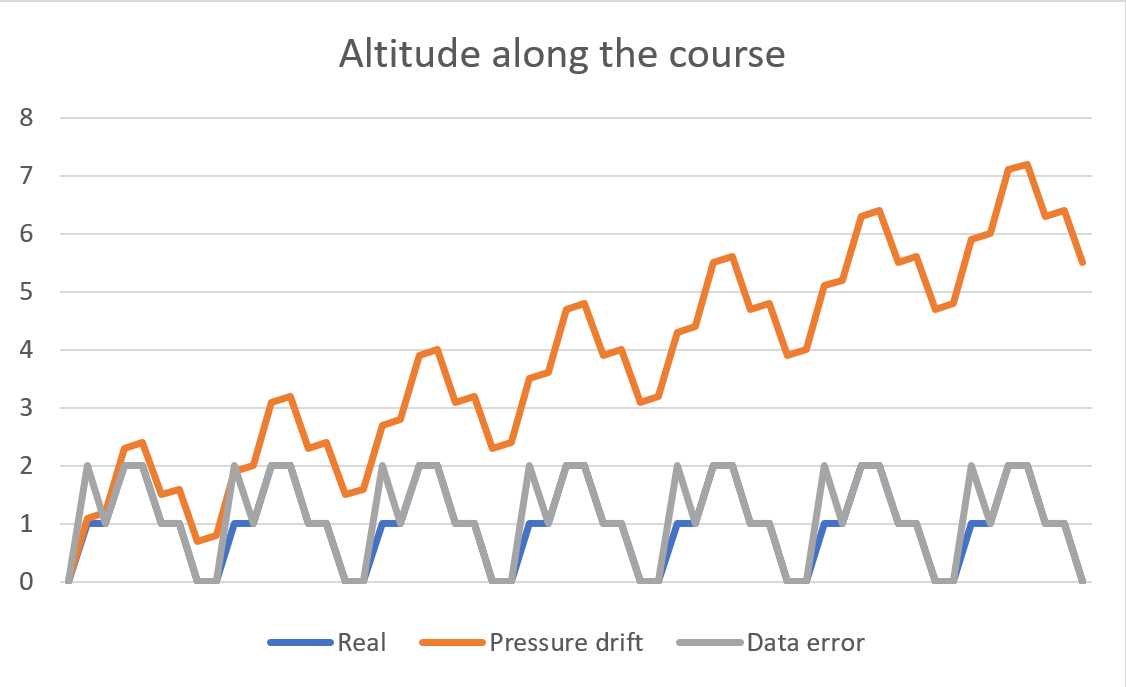
I’m not a GPS expert, but when we talk about measurement errors, we also have to consider the number of GPS points and the smoothing profile. If there are GPS points every second and the altitude is rounded to the nearest meter, it can cause problems.
If we round one point out of 2 to the meter below and the other to the meter above and there is no smoothing, the total difference in height will completely explode.
Furthermore, Strava and Google Maps (I guess strava uses Google data) do not know the topography of this place. They are based on old data before the track was made:
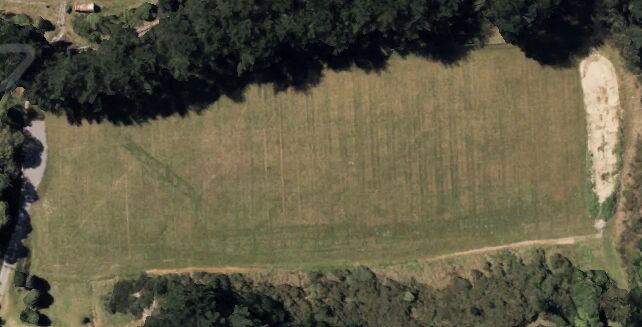
If you record the activity with your phone on the strava app, I assume that the strava topographic data will be set by default.
On a 390m loop, to estimate the real elevation gain, you have to calculate the difference in altitude between the highest point and the lowest point and then multiply it by the number of laps. I find it hard to believe that there is more than 3000m of elevation gain, which already seems enormous to me.
1 Like
I “play” with Strava GPS data sometimes.
- I believe that Strava does not use Google Maps data. Strava has different copyright info on their maps, and Strava maps look different too.
- I believe that Strava rounds elevation to 0.1 meter. Real Strava data points:
   <trkpt lat="37.8768680" lon="-121.9198890">
    <ele>1000.6</ele>
    <time>2024-10-06T17:36:07Z</time>
    <extensions>
     <gpxtpx:TrackPointExtension>
      <gpxtpx:hr>148</gpxtpx:hr>
     </gpxtpx:TrackPointExtension>
    </extensions>
   </trkpt>
   <trkpt lat="37.8768780" lon="-121.9198720">
    <ele>1000.8</ele>
    <time>2024-10-06T17:36:08Z</time>
    <extensions>
     <gpxtpx:TrackPointExtension>
      <gpxtpx:hr>149</gpxtpx:hr>
     </gpxtpx:TrackPointExtension>
    </extensions>
   </trkpt>
   <trkpt lat="37.8768860" lon="-121.9198550">
    <ele>1000.9</ele>
    <time>2024-10-06T17:36:09Z</time>
    <extensions>
     <gpxtpx:TrackPointExtension>
      <gpxtpx:hr>149</gpxtpx:hr>
     </gpxtpx:TrackPointExtension>
    </extensions>
   </trkpt>
- I believe that Strava attempts to record data points every second on an iPhone.
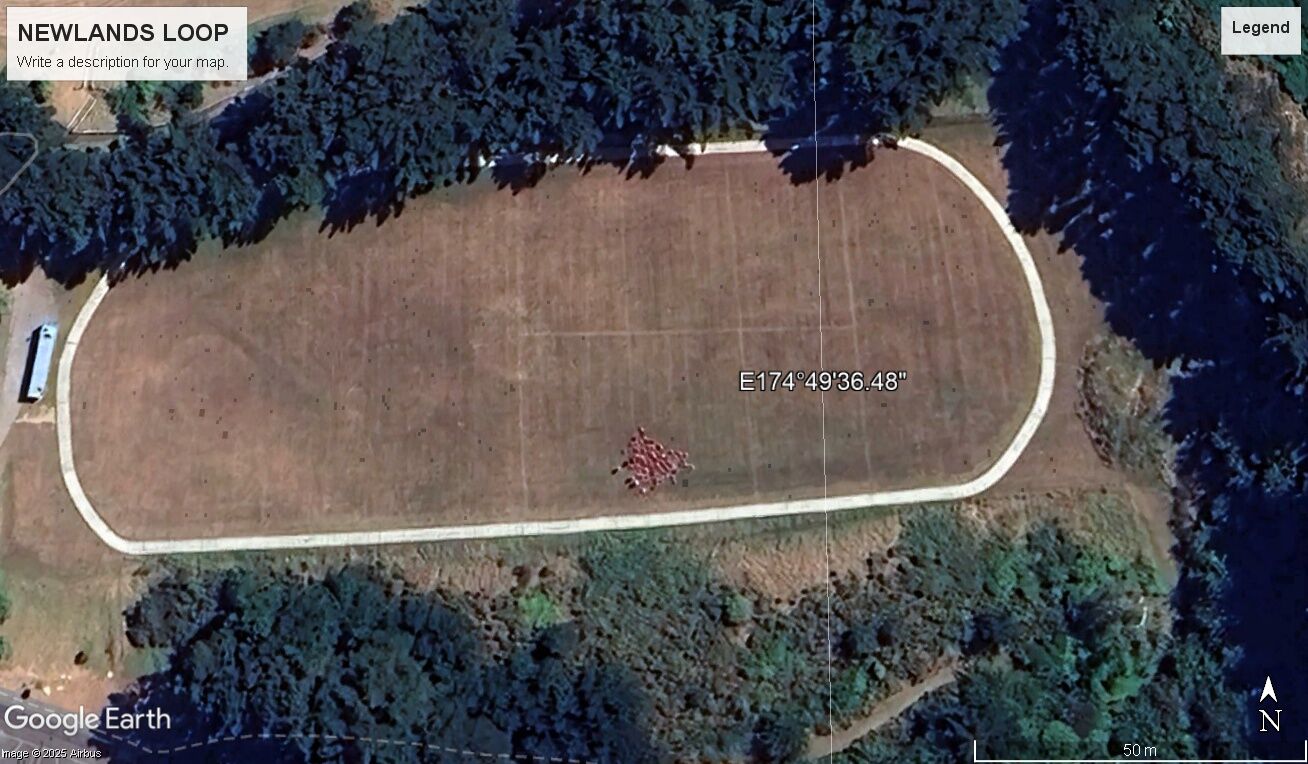
For what it is worth, above is an image from Google Earth Pro. It shows that Google actually does have up to date imagery, even though for some reason Google Maps does not. Actually, I had to fiddle with the Google Earth settings to get it as for some weird reason it defaulted to earlier imagery for this area. However, the actual data (latlon and elevation) is an “invisible grid” used only for calculations and is highly likely to be as at a different time (because the surface images and topography measurements are obtained by different means).
Strava uses some Digital Elevation Model (DEM) which is probably different from Google’s and is probably augmented (in popular riding or running areas) by user data (i.e. your data) that it has collected over the years, and it will adjust your actual raw data, depending on your device and the location, using methods which they are unlikely to disclose in detail.
Data points usually arrive from a sensor at 1s intervals, but it is up to the app what is done with that data. Storage space is reduced if there is some “on device” sampling and smoothing. So effectively the data is manipulated at the collection device and also manipulated at the data center before it ends up as a gpx file or a graph or whatever. So, as GizmoDuck said, we need to take it with a grain of salt! (and the more we dig, the messier it gets!)
3 Likes
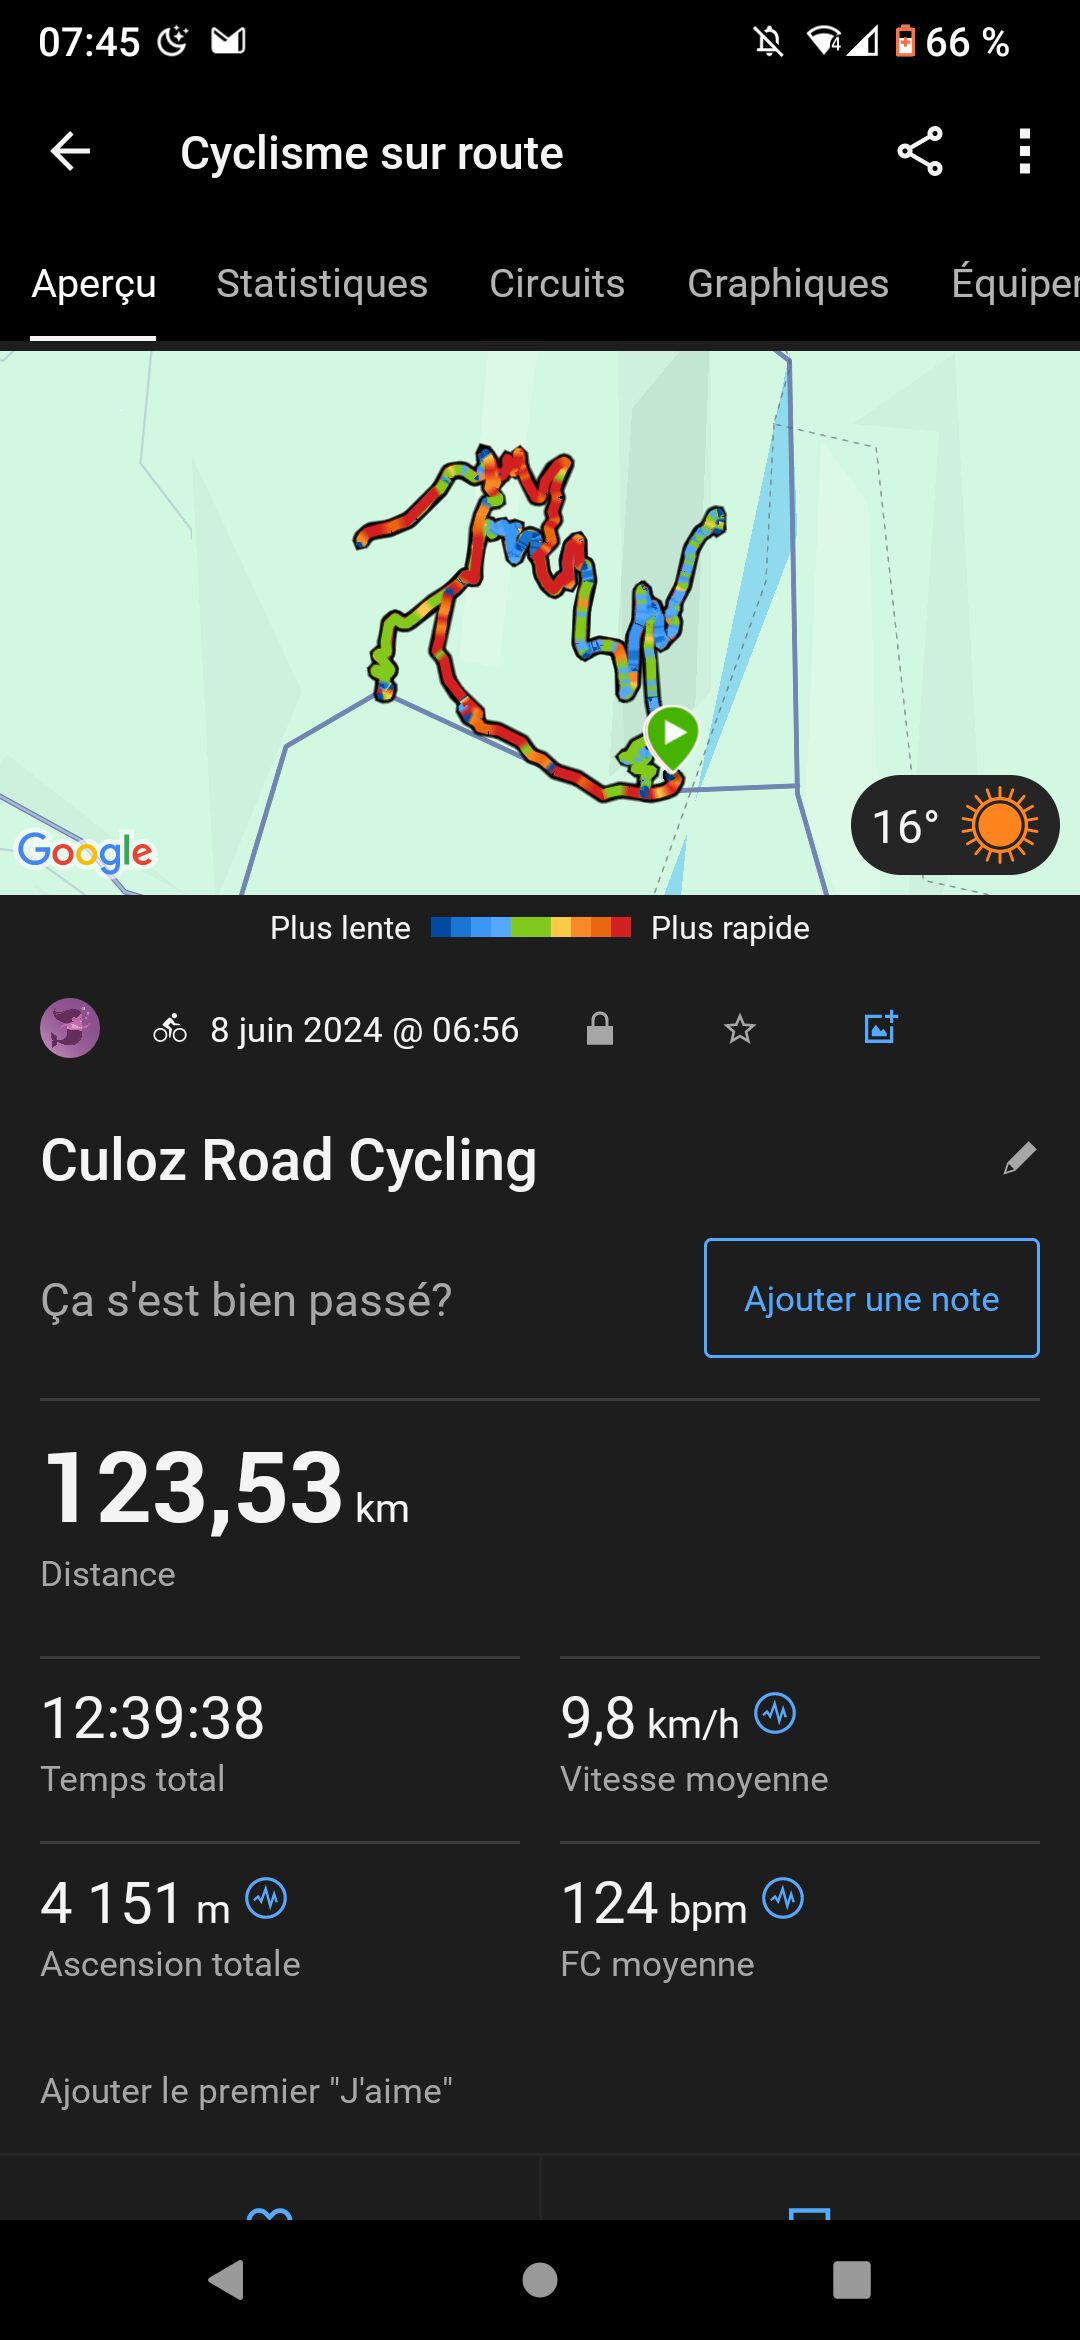
This weekend, I participated for the second time in the “24 heures de l’INSA”, a 24 hours race (primarily for bikes and running, triathlon and duathlon). I was targeting @GizmoDuck record. I was really well on the pace for the first 12 or so hours. Afterwards, it became really hard, and I ended up doing 413 km.
It was hard, painful and exhausting. I don’t think I will attempt it anymore, it is too painful for not that much.
Once again, congratulations Ken for your impressive result.
6 Likes
That is a massive achievement nonetheless! ![]()
What was most painful? I’d be concerned about saddle pain. Is there anything you’d do differently? Any advice you’d give? I’d like to give the 24 hr ride a shot sometime (not certified, just for my own PR’s sake).